
Video: Improving Occupancy in Office Buildings
A commercial real estate broker discusses strategies for improving occupancy in office buildings.
0 Comments
Chart: Commercial Properties Sold Versus Total Listings
This is a chart of the number of total commercial improved properties listed at the end of a given month (right axis) versus the number of properties sold in that month (left axis) in the Miami MLS. While the number of properties listed has declined more than 25% from its peak a few years back, the number of closed sales has held fairly steady.
0 Comments
Video: Multifamily Market Trends and Forecasts ~ Marketplace Trends
This is a video of a short discussion of major trends in multifamily with Steven DeFrancis of Courtland Partners, an investor in multifamily properties, Benno Rotschild, a lawyer with Hartman Simons who works with multifamily investors, and Jamie Teabo, a board member of the Atlanta Apartment Association and Executive VP of Post Properties, a company with multifamily properties in Florida, Georgia, Texas, and the District of Columbia, and Michael Bull, a commercial broker active in multifamily apartments in Atlanta as well as the host and producer of this video.
0 Comments
The Largest Commercial (Improved) Property Sales in the Prior Year
As of November 18, 2016, the Miami-Dade MLS lists the following properties as the largest (in dollars) transactions for commercial improved property within Miami-Dade county:
- 1135 103rd Street
- 5901 74th Street
- 2500 28th Lane
- 1495 167th Street
- 2350 173rd Street
- 5020 Biscayne Boulevard
- 9408 87th Avenue
- 1801 22nd Street
- 333 – 343 Jefferson Avenue
- 8521 Harding Avenue
- 2841 107 Avenue
- 3032 North River Drive
- 301 South River Drive
- 900 18th Avenue
- 17005 Dixie Highway
- 15005 6th Avenue
- 50 Mashta Drive
- 7500 25th Street
- 194 24th Street
Where an address is linked above, click through for information about the property including recent sales prices and dates, ownership information, and access to sales comps, tax records, and zip code information including demographics and other properties in the same zip code.
0 Comments
Commercial Property in Zip Code 33173: Year’s Top Buyers, Sellers, Ten Year Sales Volume
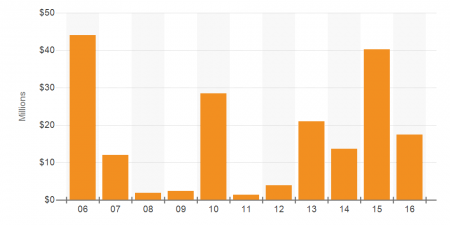
Ten Year Sales Volume for Commercial Properties Within Miami-Dade / Miami Area / South Florida Zip Code 33173 as of November 18, 2016 | Chart Courtesy of Costar
For commercial property of all types in Miami’s zip code 33173, the top buyers as listed by Costar on November 18, 2016 included: Acumen Real Estate; Equity One, Inc.; CF Properties Corp; IMC Equity Group; Luis Malo; CVS Health; Miami-Dade Parks, Recreation, and Open Space Dept; Jose Munoz; Equity One Florida Portfolio, Inc.; Chaptal. The total purchase volume of buyers for these types of properties over the past 10 years has ranged from a couple million dollars or so to as much as $40 million.
The top sellers of such properties included: Sunset Gardens Rental Apartments LC; Loeb Realty; Galloway Development Group, LLC; Breakers Capital Partners; First Washington Realty, Inc.; Equity One, Inc.; The Haven Center Inc.; Medical Park Diagnostic Center; Henry Jr. & Nancy W. Tellam; Elmer E & Nancy J Webb.
Some of the larger commercial property sales within 33173, both improved and vacant land, that were booked in the Miami-Dade MLS over the prior couple of years were 7001 SW 97th Avenue, 5626 SW 102nd Avenue, and 7001 SW 89th Court.
This was compiled using data from the CoStar Group, which provides in depth analytics for the commercial real estate industry, and the Miami-Dade MLS.
Also see:
- 33173 Demographic and Economic Data
- Top buyers, sellers, and 10 year sales volume for other Miami area zip codes
- Google map with zip code 33173 boundary
- Informational pages for properties in zip code 33173
0 Comments
Difference in Pricing of Class A, B, and C Office Leases in Miami-Dade County
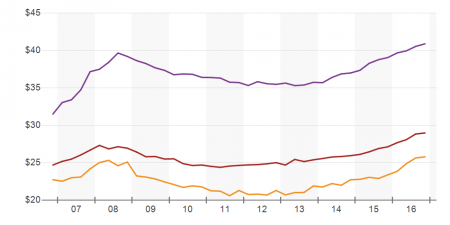
Ten Year Chart Comparing Gross Asking Rent for Class A (yellow), B (maroon), and C (purple) Office Properties in Miami-Dade County Chart Courtesy of Costar as of 11/11/16
Having recently run into a situation where a Miami office building seemed to be classified lower than it actually is, we wondered what the financial impact of this, in rental rates, might be. To get a feel for this, we evaluated average asking gross asking rent per square foot for office properties in Miami-Dade county by class, looking at A, B, and C class properties.
The charts herein show the results of all three. Looking at only the most recent prices, one can see that the average for class A is approximately $41.80, for class B is about $28.80, and for class C is about 25.75. Given this, one could conclude that class B garners 11% more in rent than class C, and class A garners 45% more than class C.
This may be understated, however, given the data source. Class A properties are almost always quoted on a triple-net (NNN) basis, as are some class B properties. We believe that the “gross rent” used in this data source would include any NNN expense, but also believe that in some cases the NNN expense has not been entered, thus registering as zero. As one comes into class B properties that are NNN, this is likely more common, as the properties tend to be less high profile. Thus, the gross rent may be understated as the class improves. In any case, we know there is a difference, and this quick analysis provides some measure of what that is in the Miami area.
A similar effect would be anticipated in valuation. The effect may be even more pronounced, actually, as higher quality properties tend to trade at lower capitalization rates (higher prices in relation to net operating income), which would further increase the spread in valuation versus that in rental rates.
Also see current sales and leasing trends charts for office properties in Coral Gables, Doral, Hialeah, Homestead, Miami, Miami Beach, Miami Lakes, Miami Springs, North Miami, North Miami Beach, and Pinecrest.
0 Comments
Commercial Property in Zip Code 33186: Year’s Top Buyers, Sellers, Ten Year Sales Volume
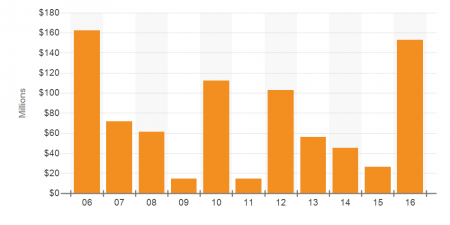
Ten Year Sales Volume for Commercial Properties Within Miami-Dade / Miami Area / South Florida Zip Code 33186 as of November 14, 2016 | Chart Courtesy of Costar
For commercial property of all types in Miami’s zip code 33186, the top buyers as listed by Costar on November 14, 2016 included: Starwood Capital Group, Deutsche Bank AG; Grand Peaks Properties; Woolbright Development, Inc.; Lowe’s Companies, Inc.; Dade Jeep Chrysler Dodge Inc.; The Simon Konover Company; Leon Medical Centers; Costco Wholesale Corporation; Universal Properties Management USA. The total purchase volume of buyers for these types of properties over the past 10 years has ranged from a ten million dollars or so to around $160 million.
The top sellers of such properties included: Equity Residential; Woolright Development Inc.; Forest City Enterprises, Inc.; 40 Acre Farm Limited Partnership; Costco Wholesale Corporation; Chrysler Realty Company, LLC; Emerald Real Estate; Florida Northeastern Development Corporation; Century Homebuilders Group LLC; Rising Tide Development, LLC.
Some of the larger sales within zip code 33186 that were booked in the Miami-Dade MLS over the prior couple of years were 12400 128th Street, 11980 144th Court, 12309 131 Avenue, and 14380 139th Court.
This was compiled using data from the CoStar Group, which provides in depth analytics for the commercial real estate industry.
Also see:
- 33186 Demographic and Economic Data
- Top buyers, sellers, and 10 year sales volume for other Miami area zip codes
- Google map with zip code 33186 boundary
- Informational pages for properties in zip code 33186
0 Comments
Commercial Property in Zip Code 33179: Year’s Top Buyers, Sellers, Ten Year Sales Volume
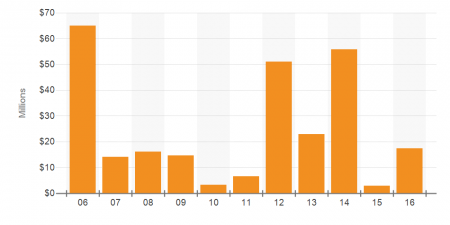
Ten Year Sales Volume for Commercial Properties Within Miami-Dade / Miami Area / South Florida Zip Code 33179 as of November 10, 2016 | Chart Courtesy of Costar
For commercial property of all types in Miami’s zip code 33179, the top buyers as listed by Costar on November 10, 2016 included: Robert Miller; The Backer Group LLC; Oded Meltzer; 3T Equity Partners; Triarch Capital Group, LLC; Bristol Group, Inc.; CFH Group; Iglesia Cristiana Senales de Vida Inc.; Advenir, Inc.; The Expansion Group Inc. The total purchase volume of buyers for these types of properties over the past 10 years has ranged from a couple million dollars to nearly $65 million.
The top sellers of such properties included: Adler Realty Service LLC; Liliane Stransky; Advenir, Inc.; Pacific Asset Corporation; Keith T Ward; Prestige Builders Partners LLC; AIMCO; U.S. Century Bank; JAG Holdings Group; Iglesia Cristiana Senales de Vida Inc.
This was compiled using data from the CoStar Group, which provides in depth analytics for the commercial real estate industry.
Also see:
- 33179 Demographic and Economic Data
- Top buyers, sellers, and 10 year sales volume for other Miami area zip codes
- Google map with zip code 33179 boundary
- Informational pages for properties in zip code 33179
0 Comments
Land Sales PSF by Miami 21 Zoning Code for the 2 Years Ending March 31, 2016
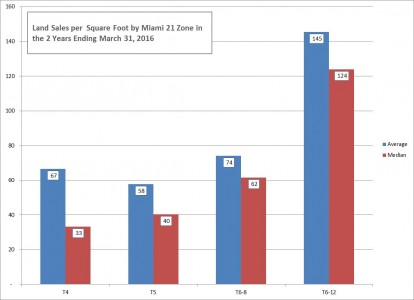
Land Sales per Square Foot for Selected Properties by Miami 21 Zoning Code – Data Courtesy of Costar
What land is worth, or more frequently, what the land under an existing structure is worth, is a common topic that comes up in the discussion of commercial real estate. Each parcel is, of course, unique. One variable that can be considered, however, is zoning.
In the accompanying chart, we have identified the average and median selling prices for vacant land by Miami 21 zone. These are not all the zones, but are the ones we typically deal with in mid-market commercial properties. As can be seen, below T6-12 zoning, prices tend to be in the mid double digits, whereas at T6-12, prices go well over $100 psf.
What are the implications of this? Consider a typical 10,000 square foot lot with a moderate quality 5,000 sf building on it. If the building’s NOI is even as little at $15 psf, a 6% cap would indicate a value of $1.25 million ($15 x 5,000 / .06), which in turn works out to $125 per square foot of land ($1,250,000 / 10,000), considerably more than selling prices tend to be for properties with zoning less generous than T6-12. That the value of developed properties is commonly more than the land underneath them is why redevelopment frequently takes longer than it intuitively seems that it would.
View vacant land listings.
View color codes maps of land sales in Miami-Dade County per acre or per square foot.
This was prepared with data from Costar, and is not warrantied or meant to be considered comprehensive.
0 Comments
A Color Coded Map of Vacant Land Sales PSF in Miami-Dade for 2 Years Ending October 31, 2015
Above is a color coded chart of vacant land sales per square foot (view per acre here) in Miami-Dade for the 2 years ending October 31, 2015. This was prepared using data from Costar, and only includes sales over $1 million. Click the full screen icon in the upper right to open this is a new window complete with a legend showing the dollar per square foot ranges for each color shade.
View vacant land listings.
0 Comments