Blackstone buys MiamiCentral office buildings for $230 million
Blackstone Group paid about $230 million for the office buildings at Brightline’s MiamiCentral station, marking one of the largest investment sales to close in South Florida this year. Funds managed by New York-based Blackstone Real Estate bought 2MiamiCentral and 3MiamiCentral from San Francisco-based Shorenstein Properties, according to a news release….
Shorenstein Properties Sells Miami Office Complex for $230 million
Shorenstein Properties, a privately owned investment firm with offices in New York City and San Francisco, has sold 2 & 3 MiamiCentral, a 320,000-square-foot office complex in the city’s downtown area. A fund backed by Blackstone purchased the property for $230 million. Constructed in 2018, the two-building complex is located within MiamiCentral, a transit…
Blackstone Expands in Miami With $230 million Office Buy
On the heels of Blackstone signing a 41,000-square-foot lease for its tech team at the recently constructed 2 MiamiCentral in Miami, funds managed by Blackstone Real Estate have purchased the entire asset along with the neighboring 3 MiamiCentral. Shorenstein Properties sold the pair of downtown office buildings for $230 million. According to…
Blackstone Drops $230 million On 2 Miami Buildings
San Francisco-based Shorenstein Properties announced Friday that it sold two high-profile Class-AA office buildings in downtown Miami to funds managed by Blackstone Real Estate for $230M. MiamiCentral is a mixed-use, transit-oriented development project that spans six city blocks. The train station was designed to accommodate Brightline private trains and…
Shorenstein Properties Sells 2 & 3 MiamiCentral to Funds Managed by Blackstone Real Estate
Shorenstein Properties, LLC (“Shorenstein”), an owner and operator of high-quality office, residential and mixed-use properties across the U.S., today announced the sale of 2 & 3 MiamiCentral to funds managed by Blackstone Real Estate (“Blackstone”) for approximately $230 million. Located in Downtown Miami, this approximately 330,000 square-foot property…
Related wins approval for another Wynwood mixed-use multifamily project
Nearly 10 months after acquiring a 2.27 acre assemblage in Wynwood’s south end, the Related Group is forging ahead with a new mixed-use project on the site. The Miami Design Review Board on Wednesday approved the developer’s proposal for a pair of 12-story buildings at 2130 North Miami Avenue and 38 Northwest 22nd Street. The project, currently known as…
Galbut development group scores approval for mixed-use North Beach resi project
The developers of one of the first projects planned for the North Beach Town Center district secured approval from the Miami Beach Design Review Board late last week. NoBe Creek LLC, an entity led by Jefferson Brackin, Russell Galbut and his daughter Marisa Galbut, wants to develop a mixed-use multifamily building at 666 71st Street. The board unanimously…
Chetrit scores $15 million for Miami River $1 billion mixed-use project
The Chetrit Group is pushing forward with its long-planned mixed-use Miami River mega-project, as it just scored a $15 million construction loan, bringing its total financing to $70 million. Chetrit Group, through affiliate MC Miami River, secured the loan from MSD PCOF Partners XXXIV, an affiliate of Michael Dell’s MSD Capital private investment firm….
Downtown Miami apartment tower Grand Station — A-Rod an investor — launches leasing
Grand Station Apartments in downtown Miami is launching preleasing of the tower, which counts retired Yankees shortstop Alex Rodriguez as an investor. Rovr Development, led by principals Oscar Rodriguez and Ricardo Vadia, is beginning to lease the 30-story, 300-unit building at 40 Northwest Third Street, near the federal courthouse, according…
Waldorf Astoria Miami, planned as the tallest resi tower south of Manhattan, launches sales
The developers of Waldorf Astoria Residences Miami, planned as the city’s tallest residential tower at 100 stories, are launching sales, The Real Deal has learned. The luxury project, at 300 Biscayne Boulevard, will be the highest skyscraper south of Manhattan at 1,049 feet tall, the developers said. Property Markets Group…
Step aside, New York; there will soon be a new big building city on the East Coast. Florida isn’t necessarily known for tall, glamorous residential or commercial buildings. As it stands, the tallest building in Florida is the Panorama Tower in the Brickell area of downtown Miami. The 85-story skyscraper is a commercial and residential building that soars 849-feet…
Venezuelan food mogul Mauro Libi nabs Miami warehouse for $8 million
A company tied to Venezuelan Mauro Libi, who owns a food empire, bought a warehouse in Miami International Park for $7.8 million. Records show Eleo Group, managed by Libi, bought a 47,668-square-foot warehouse at 7300 Northwest 35th Terrace from Medley-based window blinds and shades manufacturer Vertilux. Built in 1983, the two-story facility is on 1.8 acres…
Harbor Group International Finances Miami Hotel-to-Multifamily Conversion
Harbor Group International, LLC (“HGI”), a privately-owned international real estate investment and management firm, today announced the $27.5 million financing of a hotel-to-multifamily conversion project in the Coconut Grove neighborhood of Miami. The loan was provided to AB Asset Management (“AB AM”) to acquire and rebrand the property as a Class…
Developers see green in turning golf courses into warehouses
It’s a hole-in-one for warehouse developers. Builders have been turning golf courses into warehouse locations as the industrial space boom continues, according to Bloomberg Businessweek. In May, for example, Onondaga County in New York announced that Amazon would build a $350 million distribution center over 111 acres of land formerly occupied by the…
South Beach Businesses Feel the Pain of Spring Break Chaos and Curfew
Upon entering Miami Beach from the MacArthur Causeway, an electronic sign on Fifth Street warns visitors: “Loud Music Arrestable.” Just a few blocks to the east, vacationers walk along Ocean Drive with stereos and Bluetooth speakers, blaring music and dancing in the street outside the fenced-in dining areas of local bars and restaurants. Miami Beach is…
Spring Break Chaos On Miami Beach: Just A Blip For CRE
After big crowds converged on Miami Beach this weekend, the city imposed an 8 p.m. curfew and shut down bridges connecting the beach and the mainland — giving people just hours’ notice and backing up traffic late into the night. The restrictions are in place Thursdays, Fridays, Saturdays and Sundays through April 11. Officials, residents and business owners have…
Federal bill would give $1.5B to pro-housing localities
To combat the affordable housing crisis, three U.S. senators are set to introduce the Housing Supply and Affordability Act. The bipartisan bill would provide $1.5 billion for federal grants to local governments that commit to increase their supply of local housing, to be distributed over the next five years, according to Bloomberg CityLab. “All Americans deserve…”
Miami Beach developers nab $345M construction loan for 500 Alton
Beach developers Russell Galbut and David Martin scored a $345 construction loan for their planned residential tower at the entrance to South Beach, marking one of the largest loans to close in South Florida during the pandemic, The Real Deal has learned. Galbut’s GFO Investments and Martin’s Terra are partnering on the project at 500 Alton Road…
Miami Beach investor Greg Mirmelli to convert former Banana Republic store into mansion hotel
Miami Beach investor Greg Mirmelli bought the former Banana Republic building at 800 Collins Avenue, with plans to convert the property into a mansion hotel, The Real Deal has learned. Mirmelli paid $4.5 million for the 10,026-square-foot building, he said. Property records show the seller is 800 Collins Ave LLC, led by Sam Herzberg. Herzberg’s entity paid $9.7 million…
$5.4M Sale Arranged for Former Methodist Church and School in Miami
Gridline Properties has arranged the sale of a former Methodist church and school in Miami for $5.4 million. The 28, 947-square-foot property is located at 205 NE 87th St. in Miami’s Upper East Side and within El Portal Village. Built in 1952, the former Rader Memorial United Methodist Church has been vacant for more than 10 years. Gridline’s Alfredo Riascos…
Rock-bottom prices: 11 malls whose valuations have tanked
The pandemic has wreaked havoc across the retail industry, but few have been hit harder than second-tier malls. And it’s no surprise the largest mall operators have taken the biggest hits. Simon Property Group and Brookfield Property Partners controlled 5 of the 11 malls whose values have fallen the most, according to Trepp, which tracks commercial mortgage-backed…
Miami-based Limestone Asset Management, via a joint venture with Orion Real Estate Group, closed on Pinecrest Town Center, the mixed-use retail and office property located at 12651 South Dixie Highway, Pinecrest, FL 33156, for $32 million. Limestone Asset Management invests in and acquires real estate properties over all asset classes throughout North…
Pop-Up Hotel Concept WhyHotel Launches In Miami
A pop-up hotel concept that originated in Washington, D.C., will launch in Miami on May 1. WhyHotel takes over units in new luxury apartment buildings, bringing in revenue and adding vitality to properties during the lease-up period. In Miami, WhyHotel will operate over 100 units at AMLI Midtown Miami, a 719-unit complex at 3000 NE Second Ave. that…
Sterling Bay Signs Retail Lease with Love Life Café at 545WYN in Miami
Sterling Bay, a Chicago-based real estate development firm, has signed a retail lease with eatery Love Life Café in Miami’s Wynwood district. Love Life Café will take 3,767 square feet of storefront space at 545wyn, Wynwood’s first Class A creative office building. Sterling Bay broke ground on 545wyn in January 2019 and completed the building in late 2020.
Office sector to keep sinking until 2024, Moody’s predicts
The office market is looking at three more years of pain until it turns the corner, according to a new report. Moody’s Analytics and CWCapital note that long-term leases saved landlords from a mass exodus but downsizing will continue to erode their tenant base. As a result, the rise in subleasing and vacancy and the fall in rents will continue before starting to ease…
Sleepy No Longer, Downtown Miami Evolves Into Urban Hub
Once a place that emptied at 5 p.m., Downtown Miami is in the midst of a dramatic transformation. Overlooked no longer, the city’s central business district is getting denser, growing taller and attracting new attention. The area has been poised for a breakout since the Great Recession, and its moment finally seemed to arrive during the pandemic. Out-of-state…
Developers look to seize the moment as Miami condo craze returns
A rendering of Baccarat Miami With half the business elite seemingly moving to Miami, South Florida’s residential developers are betting that migration momentum will overcome even the market’s significant supply glut. They’re launching major condo towers set to bring thousands of new luxury units to the area, citing the spillover from booming single-family…
Israeli bond market rule changes could hinder U.S. developers
Around 30 U.S. real estate firms have raised over $5.5 billion in the Israeli bond market in the past decade (iStock) Over the past decade, U.S. developers have flocked to the Israeli bond market to obtain cheap financing for real estate projects — but that could change if new rules governing bonds are enacted. The Israel Securities Authority has…
Multifamily complex in Overtown Opportunity Zone hits market for nearly $12M
An apartment complex in an Opportunity Zone in Miami’s Overtown neighborhood hit the market with an asking price of $11.5 million. The owner of Citywalk Apartments, tied to Miami-based Armos Investments, listed the property at 415 Southwest Ninth Street after renovating some of the 92 units. The apartments were built in 1950, records show. Arthur Porosoff, David Cohen and Joseph Phelps of The Porosoff Group,…
WeWork lost $3B in 2020: report
Investors betting on WeWork’s second act just got a wake-up call. The co-working company lost $3.2 billion last year as the Covid-19 health crisis slashed the demand for flexible office spaces, the Financial Times reported, citing documents shown to possible investors. The pandemic caused WeWork’s occupancy rates to fall 47 percent in 2020, down from 72…
What’s Driving Record Industrial Real Estate Demand
The global pandemic accelerated the growth of e-commerce as lockdowns and safety concerns prompted an increasing number of consumers worldwide to shop online. As a result, several years of online sales growth were condensed into 2020 alone, causing industrial leasing to surge globally as logistics became essential for retailers. Changes in population…
Industrial Properties by U.S. Airports Command Premium Rents
According to CBRE, distribution firms want to be close to major air hubs to expedite speedy deliveries, but there is often a price to pay: Industrial rent premiums average 13 percent in the top U.S. airport submarkets and reach as high as 47% in the Chicago O’Hare submarket. In the era of next-day delivery, third-party logistics firms, ecommerce companies and retailers…
Weird flex but OK: How CRE giants hope to cash in on the future of the office
As a vision of the post-vaccine future of the workplace began to emerge late last year, Industrious co-founder Jamie Hodari was nearing a new funding round with a private equity firm in October. Then, CBRE came calling. The entrepreneur sat down for a socially distanced dinner with CEO Bob Sulentic and Andrew Kupiec, head of CBRE’s in-house co-working…
After $345 million buildout, Brightline to run new Miami-to-Aventura intercity rail
As heralded by a 2019 decision by Miami-Dade commissioners to pay $76 million for a Brightline station near Aventura Mall, county transportation decision-makers last week endorsed the for-profit inter-city rail company’s trains as the preferred mode for a Miami-to-Aventura commuter rail corridor. It will cost an estimated $345 million to build the necessary…
Mixed-use Wynwood buildings on Miami Avenue win OK
A sprawling mixed-use project designed to bring apartments, office space and more in two new buildings in Wynwood won a positive review from the city’s Urban Development Review Board. The board unanimously recommended approval of the project, known as PRH N. MIAMI, after the developer made several changes to the plan in response to issues…
Miami Today Editor suggests we need unity to bar casino perils
Whenever our economy slides, would-be casino owners look to Miami for a free lunch. All that keeps them from the lunch table is state law that bans casinos here and the integrity of enough lawmakers to keep the important barrier intact. As post-pandemic business swings back to normal, casino interests have their knives and forks out with hope of swaying Florida…
It’s not news to say that people in modern economies travel. For work, school, or pleasure. For a few hours, days, weeks, months, or even longer. Going places has been an integral and obvious part of work and life for most American households and those of any wealthy economy. It’s also not news to say that travel and work commutes came to a halt last year…
One Thousand Museum developers score $90M refi to stave off foreclosure
The developers of the Zaha Hadid-designed One Thousand Museum condo tower in Miami secured a lifeline, The Real Deal has learned. Louis Birdman, Gilberto Bomeny, Kevin Venger and partners Gregg Covin and Todd Glaser, closed on a $90 million condo inventory loan from Cirrus Real Estate Partners, according to the lender. The refinancing comes less…
Knotel to tap former top WeWork exec as CEO
Knotel is bringing on a WeWork veteran to help straighten out the bankrupt flex-operator. Former WeWork vice chairman Michael Gross will join Knotel as its chief executive, the Wall Street Journal reported. Gross’ first order of business will be to reduce Knotel’s significant losses. The company already plans to close a number of its locations as part of its bankruptcy…
Here’s where Trumpworld has put down roots in South Florida
When Donald Trump left the White House on Inauguration Day, skipping his successor’s ceremony, he flew to South Florida, which has become a base of sorts for his inner circle since election results became widely accepted. Facing a hostile reception in the ex-president’s previous home state of New York, the former president and his wife, Melania…
Changing Zoning From Residential to Commercial
Converting commercial property into residential space—like turning a parking garage into condos—has been popular recently. But what about changing zoning from residential to commercial? Commercial real estate is lucrative. Nearly $90 billion is spent building it each year. If you have a residential property, it could be well worth your time to convert it to…
Cerberus Capital, Stonemont Financial form $1 billion domestic industrial property venture
Stonemont Financial Group and an affiliate of Cerberus Capital Management LP have formed a joint venture to invest in the white-hot logistics sector. The partners want to buy as much as $1 billion worth of industrial real estate, according to Commercial Property Executive. So far, the two firms have purchased properties in Illinois, Florida, Mississippi…
Landlords shun federal rent relief over program requirements
The federal government wants to give landlords and tenants $50 billion to help keep renters in their homes — but some of those property owners are turning down the funding that they’re eligible for. Some landlords have taken issue with the requirements to receive federal rent relief, including disclosing financial information, as well as limits on evicting tenants if…
Flamboyant Miami developer Gil Dezer talks branding, car racing, partnering with Trump
Any screenwriter who pitched the character of Gil Dezer to a Hollywood studio would be laughed out of the room. A chain-smoking, gold chain-wearing, foul-mouthed developer who owns the Aston Martin DB5 James Bond drove in “Goldfinger” and was married at Donald Trump’s Mar-a-Lago? The 46-year-old president of the development firm started by his…
Newmark’s acquisition of Knotel is approved
A bankruptcy court has approved the sale of flex-office provider Knotel to brokerage Newmark. Newmark officials said they expected the deal to close quickly, Commercial Observer reported. The brokerage provided $20 million in debtor-in-possession financing after Knotel filed for bankruptcy in January, and its stalking-horse bid of $70 million brought it closer…
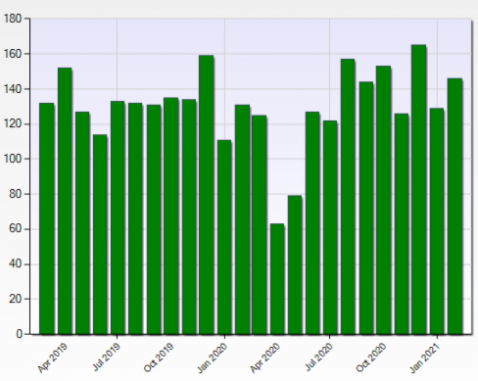
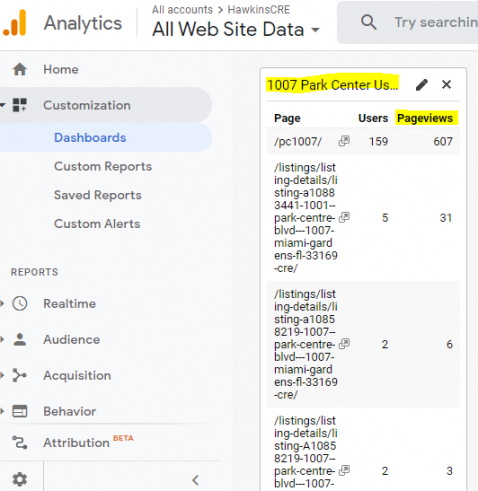
Chart: Miami-Dade Commercial Real Estate Sales February 2021
Miami MLS Number of Sales from March 2019 to February 2021 for a) Commercial, Industrial or b) Commercial, Business, Agricultural, or Industrial Vacant Land within Miami-Dade County, Florida. The chart in this post shows the number of closed sales of Miami-Dade commercial properties, including improved commercial property and vacant commercial land, that were recorded in the Miami MLS for the two…
Midtown Miami Triptych dev site owner files for Chapter 11 amid foreclosure
The owner of a development site, planned for the mixed-use project Triptych, near Midtown Miami, filed for Chapter 11 bankruptcy amid foreclosure. The companies that own the property at 3601 North Miami Avenue are controlled by HES Group CEO and managing partner Francisco Arocha, and managing partner Alberto Abilahoud. Those companies filed…
Data center demand — and rent — surge in secondary markets
As new technologies, streaming and remote work drive demand for data centers across the country, smaller markets with relatively limited supply are attracting more attention. Data center space in secondary markets rented at a rate of $134 per kilowatt per month in the second half of 2020, a significant premium from the average primary market rent of $121…
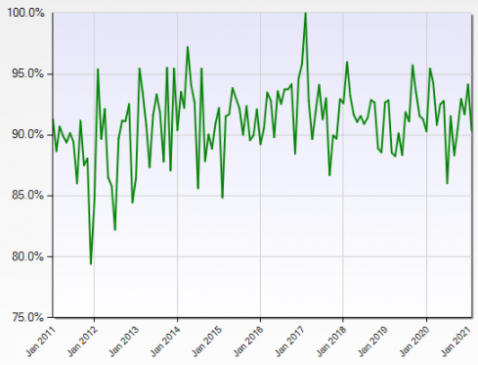
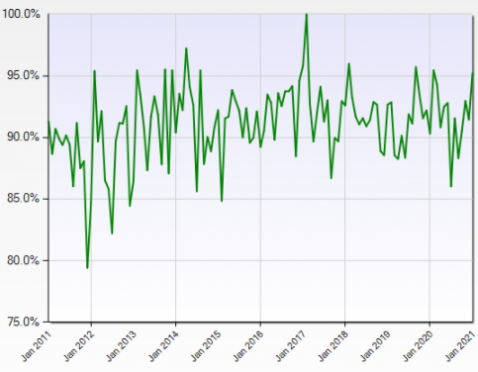
Chart: Miami Commercial Real Estate Sales to List Price Ratio February 2021
January 2011 to February 2021 Sales to List Price Ratio for Commercial/Industrial Property within Miami-Dade County, Florida and Priced from $1 Million to $10 Million as Recorded in Miami MLS The sales to list price ratio as reported by the Miami MLS for improved commercial real estate (MLS classification: commercial/industrial) within…
Woerners buy historic Paramount Theatre in Palm Beach for $14M
The historic Paramount Theatre building in Palm Beach, which opened in 1927 as a silent film cinema and later morphed into a mixed-use retail and office landmark, sold for $14 million. The family investment firm, Woerner Holdings, through its affiliate WEG Paramount, bought the property at 139 North County Road from Paramount Church, a deed shows. Paramount…
JB’s on the Beach site in Deerfield sells at a discount for $11M
JB’s on the Beach oceanfront restaurant site in Deerfield Beach sold for $11 million, more than a year after it hit the market for $18 million. Ark Restaurants, which already owns and runs the restaurant, bought the 1.5-acre property from Boyle Beach House, led by John Boyle, according to a news release. JB’s on the Beach includes a 9,777-square-foot building…
PrivCap sells assisted living facility in Hollywood for $10M
PrivCap Companies sold the Midtown Manor assisted living facility in Hollywood for $9.7 million. Boca Raton-based PrivCap, through affiliate Midtown Manor Holdings, sold the property at 2001 Polk Street to Midtown Al Propco, led by Moshe Soskin and Joseph Hirsch, according to a deed. The buyer took out a $7.5 million loan from Israel Discount Bank of New York.
Related wins approval to develop high-rise condo project in Hollywood
Hollywood commissioners approved the Related Group’s proposal to develop a high-rise condominium and community center on city-owned beachfront land. Miami-based Related would rebuild the outdated Hollywood Beach Culture and Community Center at 1301 South Ocean Drive, and develop a 30-story, 300-unit condo project on adjacent…
Fort Lauderdale shoots down $1B Bahia Mar condo project on public land
Fort Lauderdale shot down developer Jimmy Tate’s $1 billion Bahia Mar condominium project proposal, but left the door open for Tate to renegotiate his lease for the publicly owned waterfront property. Following Tate’s pitch for 651 condo units during a public meeting on Tuesday, it was clear he didn’t have the needed commission support…
Hollywood approves funding for apartment project with workforce units
Affiliated Development won city approval of its subsidized plan to develop The Tropic, an 18-story apartment building with rent-controlled “workforce” units in downtown Hollywood. The 208-unit, mixed-income apartment building at 1744 and 1753 Federal Highway will have 50 percent of its units reserved for such middle-income tenants as police officers…
Triarch buys Dania Beach industrial property for $10M
Triarch Capital Group bought a Dania Beach warehouse distribution property for $10.4 million, in a deal a broker says set a record price per square foot. Aventura-based Triarch Capital bought the two buildings at 950-952 and 940 Eller Drive as well as a next-door half-acre lot in an off-market deal, according to a press release. Records show the buildings…