
In this video, PwC U.S. Real Estate Deals Leader Tim Bodner discusses expected performance and transaction volume for 2023, touching on themes in PwC’s 2023 Real Estate Deals Outlook report. He starts off discussing current headwinds such as higher interest rates, inflation, and a war in Europe. He notes, however, that fundamental trends remain that are driving activity, logistics, residential, and continuing experiential development. He believes that these will be the tailwinds of 2023 working against the headwinds, and that these will accelerate as headwinds temper, particularly interest rates. From there, the discussion becomes much more specific, interesting and insightful all the way through.
Video: Senior VP, Research Ed Pierzak Presents 2023 Outlook for the Economy, Commercial Real Estate, and REITs
The Discussion: Navigating the 2023 Outlook for Commercial Real Estate and REITs
The commercial real estate landscape is constantly evolving, shaped by economic trends, market performance, and external factors. In a recent episode of “America’s Commercial Real Estate Show,” host Michael delved into the 2023 outlook for the economy, commercial real estate, and Real Estate Investment Trusts (REITs). Joined by Ed Pierzak, Senior Vice President of Research at NARIT, the discussion covered topics ranging from recession risks to inflation, historic REIT performance, and strategies for navigating the current market uncertainties.
Recession Risks and REIT Resilience:
The conversation kicked off with the elephant in the room: recession risks in 2023. Pierzak highlighted the concerns stemming from mixed economic growth, job gains, inflation, and rising interest rates in 2022. However, he reassured listeners that REITs are well-positioned to weather economic uncertainties. Analyzing REIT operational performance and balance sheets, Pierzak emphasized their resilience, with REITs showing robust results, particularly in the third quarter of 2022.
Impact of Interest Rates on Transaction Volume:
The surge in interest rates was acknowledged as a factor impacting transaction volume and property values. While acknowledging the influence of higher interest rates on the market, Pierzak emphasized that REITs, with their low average cost of debt, remain in a favorable position. The conversation also touched on the divergence in valuations, with REITs showing solid operational performance but experiencing declines in total returns.
Inflation and its Impact on Commercial Real Estate:
The discussion turned to inflation, a current concern for many stakeholders in the commercial real estate sector. Pierzak acknowledged the challenges posed by inflation but highlighted real estate’s historical role as an inflation hedge. Using data from NARIT’s T-Tracker, he demonstrated that REITs have been able to keep up with the pace of inflation, offering a positive outlook for 2023.
Office Sector Dynamics:
The episode addressed the unique challenges faced by the office sector, particularly in the wake of remote and hybrid working trends. Pierzak noted that the future of the office sector is still uncertain, with the impacts of work-from-home and hybrid working yet to be fully understood. Bull shared insights from his experiences in dealing with office property owners and managers, anticipating a continued decline in demand with potential recovery in the years ahead.
Historic REIT Performance and Strategic Positioning:
Pierzak delved into the historic performance of REITs during past downturns, dispelling concerns about negative property total returns during recessions. He highlighted the lead-lag relationship between public and private real estate, with REITs historically outperforming during and after recessions. The conversation explored the potential opportunities for REITs in 2023, both tactically and strategically, positioning them as resilient and well-equipped to navigate uncertainties.
Conclusion:
As the episode concluded, Pierzak left the audience with a positive outlook, describing REITs as resilient in the face of uncertainties. The 2023 outlook for commercial real estate and REITs, as discussed on “America’s Commercial Real Estate Show,” emphasized the sector’s ability to adapt and thrive amid changing economic landscapes. For those seeking more detailed insights, NARIT’s 2023 Outlook report is available on their website.
Chart: Diminished Small Business CRE Buying Power Given Higher Interest Rates
![Board of Governors of the Federal Reserve System (US), Market Yield on U.S. Treasury Securities at 10-Year Constant Maturity, Quoted on an Investment Basis [DGS10], retrieved from FRED, Federal Reserve Bank of St. Louis; https://fred.stlouisfed.org/series/DGS10, January 16, 2023.](https://www.hawkinscre.com/wp-content/uploads/2023/01/borrowing_power_cre_20230119.png)
Board of Governors of the Federal Reserve System (US), Market Yield on U.S. Treasury Securities at 10-Year Constant Maturity, Quoted on an Investment Basis [Series DGS10], retrieved from FRED, Federal Reserve Bank of St. Louis; January 16, 2023.
The above chart displays the loan amount per $10,000 of monthly principal and interest (P&I) payment on a 25 year amortization schedule and assuming an interest rate 2.5% above the 10 year treasury. The actual spread varies over time and between institutions, of course.
“Money often costs too much.”
~Ralph Waldo Emerson
The idea here is to generally represent the effect on the buying power of an available income stream, either by way of a corporate budget or a debt service coverage ratio financing requirement, of changes in interest rates. Highlighted is the 28% drop from the maximum “buying power” to minimum of the last couple of years. For businesses purchasing real estate utilizing financing, this is a real effect, similar to the effect on homebuyers as interest rates change.
0 Comments
Video: Trepp’s Lonnie Hendry Discusses Loan Delinquency Forecast
Lonnie Hendry with Trepp joins Michael Bull of America’s Commercial Real Estate Show to share the current status of troubled loans and expectations moving forward. Discussions include advice for borrowers facing looming loan maturities, and investors looking for opportunities.
Trepp is a leading provider of information, analytics, and services to the structured finance, commercial real estate, and banking markets. Their expanded data sets and market-moving insights provide clients with a more complete picture delivering perhaps unmatched intelligence.
Charts: Miami Area Leads Inbound Moves from 2019 to 2022 as Population Declines Slightly
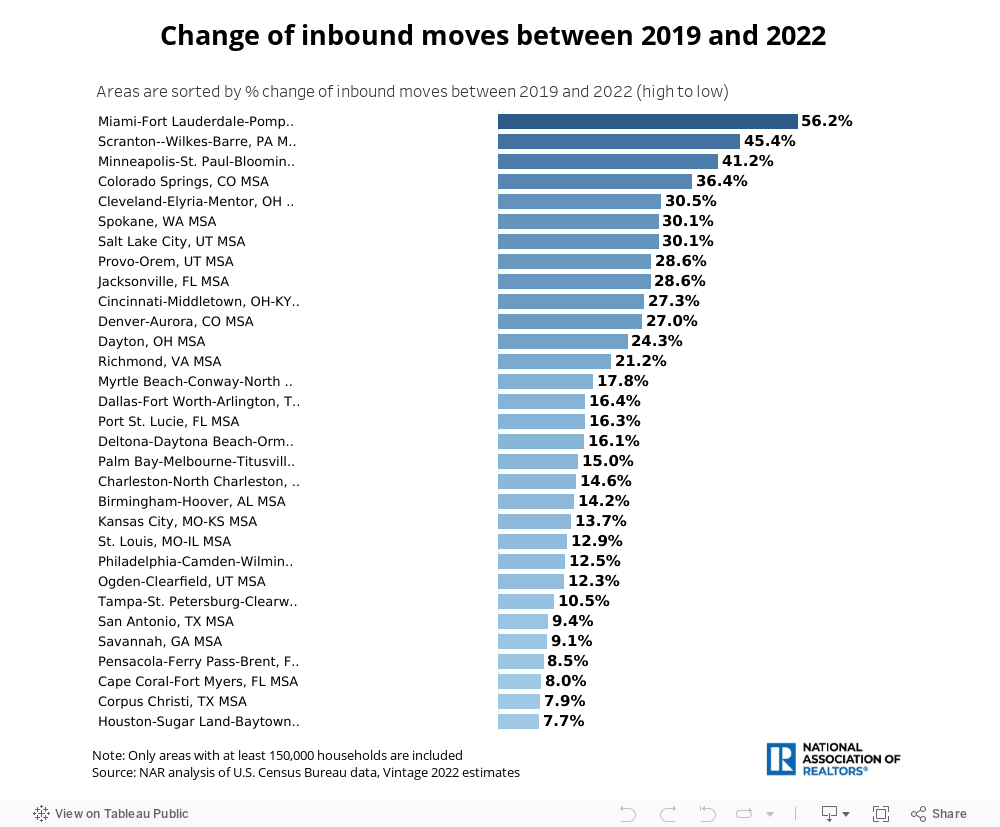
As can be seen in this chart, the Miami metro area had the largest inbound gains in the country during 2022 versus pre-pandemic 2019. Inbound moves in 2022 increased by near 60% in 2022 compared to 2019 in South Florida. Other charts related to this and related commentary can be found at a recent NAR post, “Where People Moved in 2022.” The biggest surprise here is that Scranton came in second. Scranton! With that influx, presumably Dunder Mifflin will have less challenges finding another Assistant to the General Manager should Dwight be lured away to the sunny 0% state income tax number 1 area on this list.
Also surprising is that Miami-Dade actually experience net migration since COVID-19, as displayed in an ARCGIS dashboard. this was discussed this in a recent Miami Today article, “Magnet pull of South Florida on US residents is just a myth“, as did the Miami Herald in another, “Miami metro residents most rent-burdened in U.S.; Census figures show county population drop.” What appears to be happening, then, is not so much an increase in the population, but instead an increase in the affluence of the population as those that can’t afford it leave to be replaced by those that can.
Although the data ends in 2020, one can see these trends have been going on for some time in St Louis Fed data:
![U.S. Census Bureau, Resident Population in Miami-Dade County, FL [FLMIAM6POP], retrieved from FRED, Federal Reserve Bank of St. Louis; https://fred.stlouisfed.org/series/FLMIAM6POP, February 10, 2023.](https://www.hawkinscre.com/wp-content/uploads/2023/02/miami-dade-resident-population.png)
U.S. Census Bureau, Resident Population in Miami-Dade County, FL [FLMIAM6POP], retrieved from FRED, Federal Reserve Bank of St. Louis; https://fred.stlouisfed.org/series/FLMIAM6POP, February 10, 2023.
![U.S. Census Bureau, Estimate of Median Household Income for Miami-Dade County, FL [MHIFL12086A052NCEN], retrieved from FRED, Federal Reserve Bank of St. Louis; https://fred.stlouisfed.org/series/MHIFL12086A052NCEN, February 10, 2023.](https://www.hawkinscre.com/wp-content/uploads/2023/02/miami-dade-median-income.png)
U.S. Census Bureau, Estimate of Median Household Income for Miami-Dade County, FL [MHIFL12086A052NCEN], retrieved from FRED, Federal Reserve Bank of St. Louis; https://fred.stlouisfed.org/series/MHIFL12086A052NCEN, February 10, 2023.
Chart: Commercial Real Estate Quarterly Price Index Moves, Calculated Standard Deviation, Empirical Rule Observations Utilizing FRED Data
![Board of Governors of the Federal Reserve System (US), Interest Rates and Price Indexes; Commercial Real Estate Price Index, Level [BOGZ1FL075035503Q], index levels retrieved from FRED, Federal Reserve Bank of St. Louis; https://fred.stlouisfed.org/series/BOGZ1FL075035503Q, January 16, 2023.](https://www.hawkinscre.com/wp-content/uploads/2023/01/commercial_real_estate_price_index_quarterly_b.png)
Board of Governors of the Federal Reserve System (US), Interest Rates and Price Indexes; Commercial Real Estate Price Index, Level [BOGZ1FL075035503Q], index levels retrieved from FRED, Federal Reserve Bank of St. Louis; Series BOGZ1FL075035503Q, January 16, 2023.The chart herein shows the quarterly change of the Commercial Real Estate Price Index from the Board of Governors of the US Federal Reserve System as of January 17, 2023. The data set utilized for this chart is posted below.
Having a published data set allows for calculation of the standard deviation of these returns, noted above as 2.55%. Since these are quarterly, one would divide that by the square root of 4 to arrive at the annualized standard deviation of 5.1%. The quarterly return of 1.06% would be annualized by compounding the return to arrive at an annualized rate of 4.30%, with the compounding adding just a bit more return than if multiplied by 4.
Commercial Real Estate Price Index Summary Calculations
| Average Quarterly Change | 1.06% |
| Annualized Change | 4.30% |
| Quarterly Standard Deviation | 2.55% |
| Annualized SD | 5.10% |
These changes are for the price index only, whereas owners of commercial real estate generally earn income. That rate varies over time, and there is no such corresponding data set over time of which I am aware. For approximation purposes, however, we’ll assume a 5% capitalization rate for all periods in order to run some empirical rule calculations.
“Risk means more things can happen than will happen.”
~ Elroy Dimson
Empirical Rule Calculations
| Price Change | Total Return | |
| Annualized Change | 4.30% | 4.30% |
| Assumed Cap Rate | n/a | 5.00% |
| Average Total Return | n/a | 9.30% |
| 68% of the time (1 SD) | -0.80% to 9.39% | 4.20% to 14.39% |
| 95% of the time (2 SD) | -5.89% to 14.49% | -0.89% to 19.49% |
| 99.7% of the time (3 SD) | -10.99% to 19.58% | -5.99% to 24.58% |
Going by this set of data, it would appear the only about once every 666 years would the total return be worse than -10.99% (1 / [1-99.7%] x 50%). That sounds pretty good, but it also doesn’t seem quite right. Allow me to consider some potential faults with this.
First, I have no idea what goes into this index. It is an index of the Fed. One can assume it is highly diversified, as very few investors are. If you are loaded up on retail properties in Wynwood, what happens nationally is only minimally applicable. Additionally, many investors carry debt, and debt magnifies returns. Finally, this does not feel right. I think the standard deviation feels a bit higher than 5.1%. In prior post, Applying the Black & Scholes Option Pricing Model to Commercial Real Estate Option Pricing, I gave a set of reasons for assuming standard deviation as 6.5%. I still feel more comfortable with that level, frankly. What this Fed data has done for me is to get more comfortable that 6.5% itself is not substantially low, and might even be a touch high. Thank you, FRED.
A final note I’d make about this is that an investor, before allowing this to provide comfort regarding assumed risk, should look at the -30.22% index price move for the year of 2009. That more than 3 SD move deviates considerably from the rest of the dataset. That begs the question of whether that is a black swan type event, i.e. an aberration, if there is something amiss with that 2009 price index data, or if there is something about this 1952 to 2022 period that, aside from 2009, was preternaturally steady for commercial real estate prices (or some combination thereof). My conclusion is that Yogi Berra had it right long ago when he quipped; “It’s tough to make predictions, especially about the future.”
Commercial Real Estate Price Index Level Data:
Board of Governors of the Federal Reserve System (US), Interest Rates and Price Indexes; Commercial Real Estate Price Index, Level [BOGZ1FL075035503Q], index levels retrieved from FRED, Federal Reserve Bank of St. Louis; Series BOGZ1FL075035503Q, January 16, 2023.The chart herein shows the quarterly change of the Commercial Real Estate Price Index from the Board of Governors of the US Federal Reserve System as of January 17, 2023.
| Period | Index Level | Quarterly Change |
| Q1 1952 | 20251 | |
| Q2 1952 | 20187 | -0.32% |
| Q3 1952 | 20137 | -0.25% |
| Q4 1952 | 20187 | 0.25% |
| Q1 1953 | 20238 | 0.25% |
| Q2 1953 | 20529 | 1.44% |
| Q3 1953 | 20807 | 1.35% |
| Q4 1953 | 20769 | -0.18% |
| Q1 1954 | 20478 | -1.40% |
| Q2 1954 | 20276 | -0.99% |
| Q3 1954 | 20276 | 0.00% |
| Q4 1954 | 20301 | 0.12% |
| Q1 1955 | 20352 | 0.25% |
| Q2 1955 | 20529 | 0.87% |
| Q3 1955 | 20807 | 1.35% |
| Q4 1955 | 21275 | 2.25% |
| Q1 1956 | 22224 | 4.46% |
| Q2 1956 | 22148 | -0.34% |
| Q3 1956 | 22742 | 2.68% |
| Q4 1956 | 22957 | 0.95% |
| Q1 1957 | 23185 | 0.99% |
| Q2 1957 | 23489 | 1.31% |
| Q3 1957 | 23640 | 0.64% |
| Q4 1957 | 23628 | -0.05% |
| Q1 1958 | 23071 | -2.36% |
| Q2 1958 | 23223 | 0.66% |
| Q3 1958 | 23312 | 0.38% |
| Q4 1958 | 23375 | 0.27% |
| Q1 1959 | 23223 | -0.65% |
| Q2 1959 | 23362 | 0.60% |
| Q3 1959 | 23451 | 0.38% |
| Q4 1959 | 23463 | 0.05% |
| Q1 1960 | 23552 | 0.38% |
| Q2 1960 | 23413 | -0.59% |
| Q3 1960 | 23299 | -0.49% |
| Q4 1960 | 23135 | -0.70% |
| Q1 1961 | 23135 | 0.00% |
| Q2 1961 | 23185 | 0.22% |
| Q3 1961 | 23210 | 0.11% |
| Q4 1961 | 23299 | 0.38% |
| Q1 1962 | 23337 | 0.16% |
| Q2 1962 | 23425 | 0.38% |
| Q3 1962 | 23387 | -0.16% |
| Q4 1962 | 23463 | 0.32% |
| Q1 1963 | 23539 | 0.32% |
| Q2 1963 | 23590 | 0.22% |
| Q3 1963 | 23653 | 0.27% |
| Q4 1963 | 23678 | 0.11% |
| Q1 1964 | 23653 | -0.11% |
| Q2 1964 | 23906 | 1.07% |
| Q3 1964 | 23944 | 0.16% |
| Q4 1964 | 24323 | 1.58% |
| Q1 1965 | 24361 | 0.16% |
| Q2 1965 | 24539 | 0.73% |
| Q3 1965 | 24602 | 0.26% |
| Q4 1965 | 25095 | 2.00% |
| Q1 1966 | 25019 | -0.30% |
| Q2 1966 | 25576 | 2.23% |
| Q3 1966 | 25614 | 0.15% |
| Q4 1966 | 25943 | 1.28% |
| Q1 1967 | 26056 | 0.44% |
| Q2 1967 | 26196 | 0.54% |
| Q3 1967 | 26373 | 0.68% |
| Q4 1967 | 26739 | 1.39% |
| Q1 1968 | 27106 | 1.37% |
| Q2 1968 | 27460 | 1.31% |
| Q3 1968 | 27688 | 0.83% |
| Q4 1968 | 28384 | 2.51% |
| Q1 1969 | 28788 | 1.42% |
| Q2 1969 | 29256 | 1.63% |
| Q3 1969 | 29649 | 1.34% |
| Q4 1969 | 30218 | 1.92% |
| Q1 1970 | 30521 | 1.00% |
| Q2 1970 | 31470 | 3.11% |
| Q3 1970 | 31559 | 0.28% |
| Q4 1970 | 32065 | 1.60% |
| Q1 1971 | 32748 | 2.13% |
| Q2 1971 | 33494 | 2.28% |
| Q3 1971 | 34227 | 2.19% |
| Q4 1971 | 34835 | 1.78% |
| Q1 1972 | 35518 | 1.96% |
| Q2 1972 | 35960 | 1.24% |
| Q3 1972 | 36454 | 1.37% |
| Q4 1972 | 37162 | 1.94% |
| Q1 1973 | 37706 | 1.46% |
| Q2 1973 | 38515 | 2.15% |
| Q3 1973 | 39578 | 2.76% |
| Q4 1973 | 40552 | 2.46% |
| Q1 1974 | 41627 | 2.65% |
| Q2 1974 | 43436 | 4.35% |
| Q3 1974 | 45447 | 4.63% |
| Q4 1974 | 47357 | 4.20% |
| Q1 1975 | 48736 | 2.91% |
| Q2 1975 | 49621 | 1.82% |
| Q3 1975 | 50038 | 0.84% |
| Q4 1975 | 50633 | 1.19% |
| Q1 1976 | 50924 | 0.57% |
| Q2 1976 | 51847 | 1.81% |
| Q3 1976 | 52606 | 1.46% |
| Q4 1976 | 53352 | 1.42% |
| Q1 1977 | 55009 | 3.11% |
| Q2 1977 | 56009 | 1.82% |
| Q3 1977 | 57261 | 2.24% |
| Q4 1977 | 58450 | 2.08% |
| Q1 1978 | 59715 | 2.16% |
| Q2 1978 | 61384 | 2.79% |
| Q3 1978 | 62915 | 2.49% |
| Q4 1978 | 64635 | 2.73% |
| Q1 1979 | 66456 | 2.82% |
| Q2 1979 | 68468 | 3.03% |
| Q3 1979 | 70593 | 3.10% |
| Q4 1979 | 72098 | 2.13% |
| Q1 1980 | 73350 | 1.74% |
| Q2 1980 | 74855 | 2.05% |
| Q3 1980 | 76436 | 2.11% |
| Q4 1980 | 78802 | 3.10% |
| Q1 1981 | 82255 | 4.38% |
| Q2 1981 | 85139 | 3.51% |
| Q3 1981 | 87580 | 2.87% |
| Q4 1981 | 90628 | 3.48% |
| Q1 1982 | 92563 | 2.14% |
| Q2 1982 | 93512 | 1.03% |
| Q3 1982 | 93778 | 0.28% |
| Q4 1982 | 93322 | -0.49% |
| Q1 1983 | 91703 | -1.73% |
| Q2 1983 | 90742 | -1.05% |
| Q3 1983 | 90527 | -0.24% |
| Q4 1983 | 90388 | -0.15% |
| Q1 1984 | 90502 | 0.13% |
| Q2 1984 | 91400 | 0.99% |
| Q3 1984 | 91969 | 0.62% |
| Q4 1984 | 92513 | 0.59% |
| Q1 1985 | 93196 | 0.74% |
| Q2 1985 | 93423 | 0.24% |
| Q3 1985 | 93917 | 0.53% |
| Q4 1985 | 92263 | -1.76% |
| Q1 1986 | 94072 | 1.96% |
| Q2 1986 | 95917 | 1.96% |
| Q3 1986 | 97275 | 1.42% |
| Q4 1986 | 98651 | 1.41% |
| Q1 1987 | 100624 | 2.00% |
| Q2 1987 | 102637 | 2.00% |
| Q3 1987 | 103197 | 0.55% |
| Q4 1987 | 103761 | 0.55% |
| Q1 1988 | 104925 | 1.12% |
| Q2 1988 | 106102 | 1.12% |
| Q3 1988 | 106366 | 0.25% |
| Q4 1988 | 106630 | 0.25% |
| Q1 1989 | 107602 | 0.91% |
| Q2 1989 | 108583 | 0.91% |
| Q3 1989 | 108981 | 0.37% |
| Q4 1989 | 109380 | 0.37% |
| Q1 1990 | 108414 | -0.88% |
| Q2 1990 | 107456 | -0.88% |
| Q3 1990 | 107014 | -0.41% |
| Q4 1990 | 106574 | -0.41% |
| Q1 1991 | 105565 | -0.95% |
| Q2 1991 | 104565 | -0.95% |
| Q3 1991 | 101038 | -3.37% |
| Q4 1991 | 97629 | -3.37% |
| Q1 1992 | 95396 | -2.29% |
| Q2 1992 | 93214 | -2.29% |
| Q3 1992 | 90705 | -2.69% |
| Q4 1992 | 88264 | -2.69% |
| Q1 1993 | 87385 | -1.00% |
| Q2 1993 | 86514 | -1.00% |
| Q3 1993 | 86432 | -0.09% |
| Q4 1993 | 86351 | -0.09% |
| Q1 1994 | 87355 | 1.16% |
| Q2 1994 | 88371 | 1.16% |
| Q3 1994 | 89332 | 1.09% |
| Q4 1994 | 90361 | 1.15% |
| Q1 1995 | 90609 | 0.27% |
| Q2 1995 | 90517 | -0.10% |
| Q3 1995 | 91234 | 0.79% |
| Q4 1995 | 92103 | 0.95% |
| Q1 1996 | 92508 | 0.44% |
| Q2 1996 | 92706 | 0.21% |
| Q3 1996 | 92062 | -0.69% |
| Q4 1996 | 97578 | 5.99% |
| Q1 1997 | 105208 | 7.82% |
| Q2 1997 | 105076 | -0.13% |
| Q3 1997 | 108845 | 3.59% |
| Q4 1997 | 118284 | 8.67% |
| Q1 1998 | 120779 | 2.11% |
| Q2 1998 | 125194 | 3.66% |
| Q3 1998 | 126035 | 0.67% |
| Q4 1998 | 128231 | 1.74% |
| Q1 1999 | 124173 | -3.16% |
| Q2 1999 | 124148 | -0.02% |
| Q3 1999 | 129608 | 4.40% |
| Q4 1999 | 131754 | 1.66% |
| Q1 2000 | 124986 | -5.14% |
| Q2 2000 | 134097 | 7.29% |
| Q3 2000 | 143235 | 6.81% |
| Q4 2000 | 145523 | 1.60% |
| Q1 2001 | 144348 | -0.81% |
| Q2 2001 | 144419 | 0.05% |
| Q3 2001 | 146031 | 1.12% |
| Q4 2001 | 138637 | -5.06% |
| Q1 2002 | 142534 | 2.81% |
| Q2 2002 | 141553 | -0.69% |
| Q3 2002 | 143702 | 1.52% |
| Q4 2002 | 149685 | 4.16% |
| Q1 2003 | 155085 | 3.61% |
| Q2 2003 | 153646 | -0.93% |
| Q3 2003 | 149486 | -2.71% |
| Q4 2003 | 151562 | 1.39% |
| Q1 2004 | 160823 | 6.11% |
| Q2 2004 | 168963 | 5.06% |
| Q3 2004 | 180109 | 6.60% |
| Q4 2004 | 179950 | -0.09% |
| Q1 2005 | 185359 | 3.01% |
| Q2 2005 | 188982 | 1.95% |
| Q3 2005 | 197615 | 4.57% |
| Q4 2005 | 204345 | 3.41% |
| Q1 2006 | 210633 | 3.08% |
| Q2 2006 | 219424 | 4.17% |
| Q3 2006 | 224992 | 2.54% |
| Q4 2006 | 229588 | 2.04% |
| Q1 2007 | 236791 | 3.14% |
| Q2 2007 | 246337 | 4.03% |
| Q3 2007 | 251033 | 1.91% |
| Q4 2007 | 249708 | -0.53% |
| Q1 2008 | 229637 | -8.04% |
| Q2 2008 | 233844 | 1.83% |
| Q3 2008 | 227650 | -2.65% |
| Q4 2008 | 221291 | -2.79% |
| Q1 2009 | 208222 | -5.91% |
| Q2 2009 | 170622 | -18.06% |
| Q3 2009 | 165721 | -2.87% |
| Q4 2009 | 154418 | -6.82% |
| Q1 2010 | 159893 | 3.55% |
| Q2 2010 | 172414 | 7.83% |
| Q3 2010 | 170781 | -0.95% |
| Q4 2010 | 171868 | 0.64% |
| Q1 2011 | 178250 | 3.71% |
| Q2 2011 | 174805 | -1.93% |
| Q3 2011 | 172509 | -1.31% |
| Q4 2011 | 182451 | 5.76% |
| Q1 2012 | 182977 | 0.29% |
| Q2 2012 | 182262 | -0.39% |
| Q3 2012 | 185364 | 1.70% |
| Q4 2012 | 188270 | 1.57% |
| Q1 2013 | 191017 | 1.46% |
| Q2 2013 | 202087 | 5.80% |
| Q3 2013 | 213128 | 5.46% |
| Q4 2013 | 212451 | -0.32% |
| Q1 2014 | 209591 | -1.35% |
| Q2 2014 | 219049 | 4.51% |
| Q3 2014 | 223174 | 1.88% |
| Q4 2014 | 230717 | 3.38% |
| Q1 2015 | 241231 | 4.56% |
| Q2 2015 | 246152 | 2.04% |
| Q3 2015 | 246392 | 0.10% |
| Q4 2015 | 244138 | -0.91% |
| Q1 2016 | 239814 | -1.77% |
| Q2 2016 | 248433 | 3.59% |
| Q3 2016 | 256867 | 3.39% |
| Q4 2016 | 257315 | 0.17% |
| Q1 2017 | 252540 | -1.86% |
| Q2 2017 | 266115 | 5.38% |
| Q3 2017 | 268458 | 0.88% |
| Q4 2017 | 272567 | 1.53% |
| Q1 2018 | 274951 | 0.87% |
| Q2 2018 | 275509 | 0.20% |
| Q3 2018 | 276359 | 0.31% |
| Q4 2018 | 272775 | -1.30% |
| Q1 2019 | 285385 | 4.62% |
| Q2 2019 | 299015 | 4.78% |
| Q3 2019 | 296344 | -0.89% |
| Q4 2019 | 294000 | -0.79% |
| Q1 2020 | 298895 | 1.66% |
| Q2 2020 | 295352 | -1.19% |
| Q3 2020 | 300713 | 1.82% |
| Q4 2020 | 312942 | 4.07% |
| Q1 2021 | 314009 | 0.34% |
| Q2 2021 | 322439 | 2.68% |
| Q3 2021 | 345789 | 7.24% |
| Q4 2021 | 358385 | 3.64% |
| Q1 2022 | 349813 | -2.39% |
| Q2 2022 | 348985 | -0.24% |
| Q3 2022 | 358378 | 2.69% |
~
Don’t rely on this in any way to make investment decisions. These are just observations, and may be incorrect. On that note, if you find an error in the calculations, logic, or assumptions, contact me and let me know!
0 Comments
Charts: Miami-Dade Commercial Real Estate Sales vs. Average, and vs. 5-Year Treasury, Five Years Ending December 2022
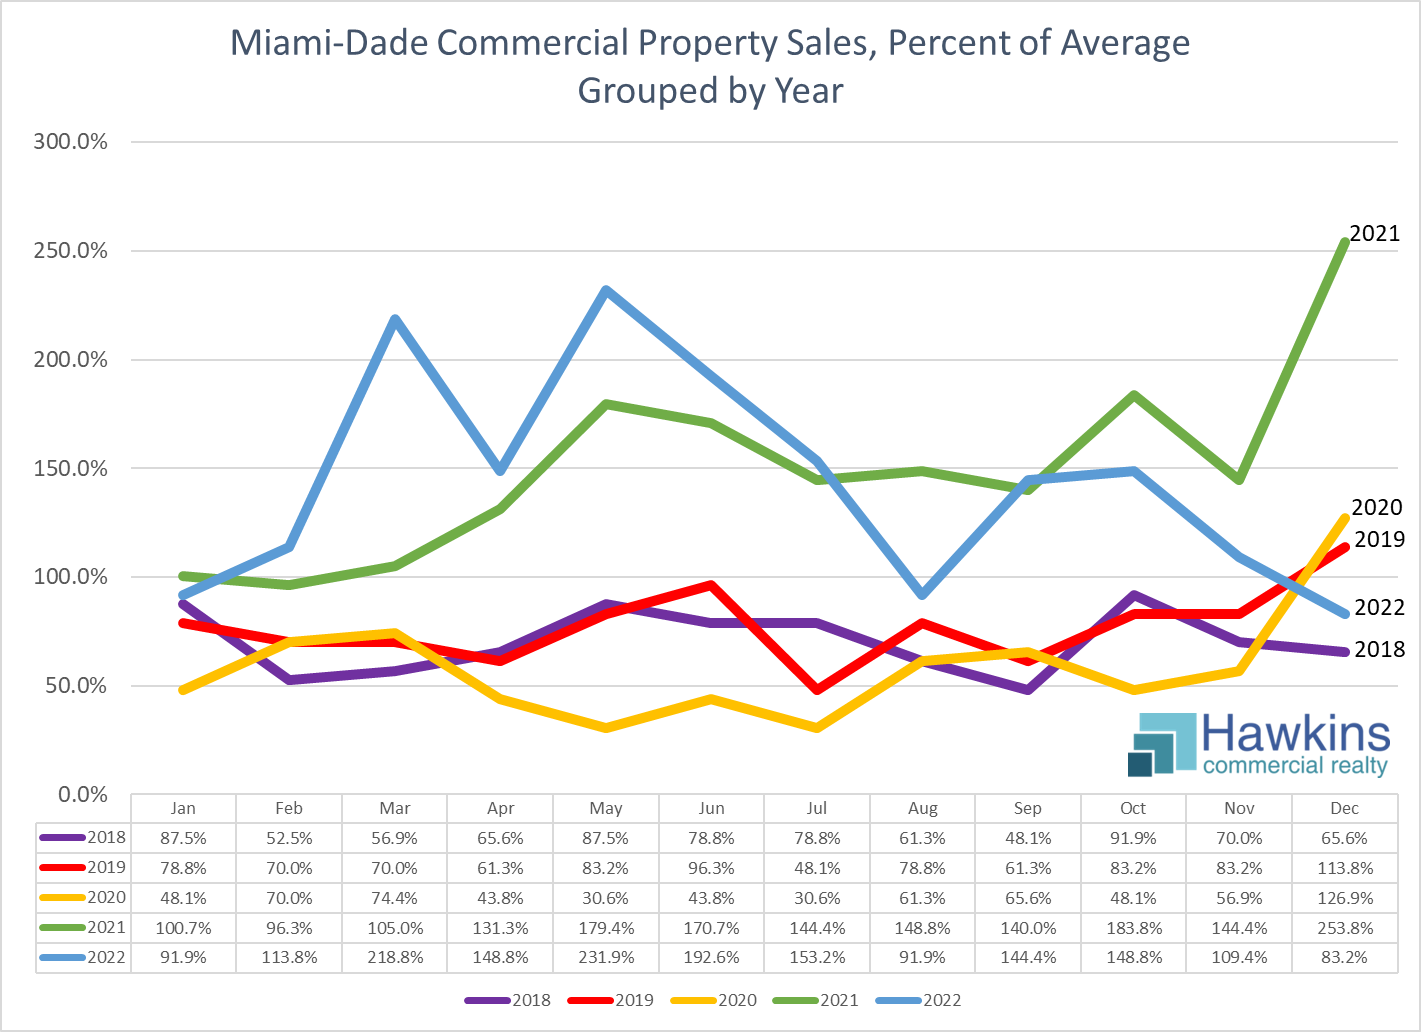
January 2018 to December 2022 Commercial MLS Miami Association of Realtors, Property Types Land-Commercial/Business/Agricultural/Industrial, Commercial/Industrial, within Miami-Dade County, Price $1,000,000+, Calculated from 1,371 Listings, Dataset Obtained 1/10/23
In the chart above, the number of closed sales as a percentage of the five year average is plotted by month, grouped by year; the dataset is displayed just below. The most striking element is the year end surge of 2021, with closed sales exceeded 250% of the average. The next most striking thing is perhaps the surge in the first half of 2022, which is of course really a continuance of late 2021. The third most striking thing is the plunge from elevated levels only five months prior to ones one might refer to as more normal at year end 2022, with closed sales at 83.2% of the average for the prior five years, down from 254% in December 2021 and 153% as late as July 2021.
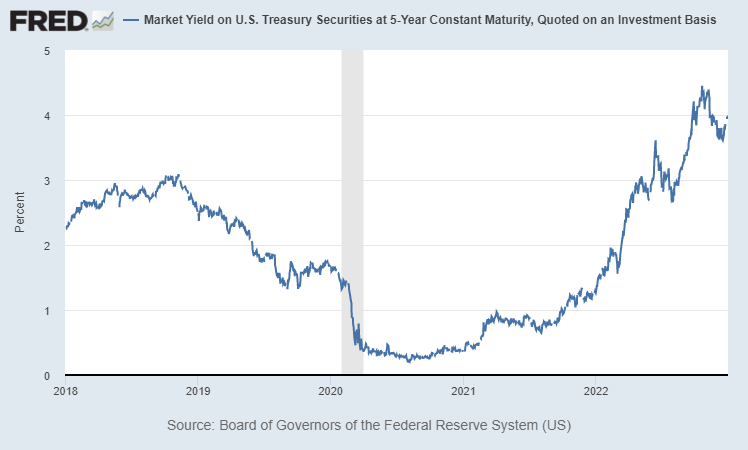
![Miami-Dade Commercial Property Sales Percent of Average vs. 5-Year US Treasury Yield: January 2018 to December 2022 Commercial MLS Miami Association of Realtors, Property Types Land-Commercial/Business/Agricultural/Industrial, Commercial/Industrial, within Miami-Dade County, Price $1,000,000+, Calculated from 1,371 Listings, Retrieved 1/10/23 | Board of Governors of the Federal Reserve System (US), Market Yield on U.S. Treasury Securities at 5-Year Constant Maturity, Quoted on an Investment Basis [DGS5], retrieved from FRED, Federal Reserve Bank of St. Louis, January 9, 2023.](https://www.hawkinscre.com/wp-content/uploads/2023/01/cmls_commercial_sales_miami_dade_comps_past_5_years_not_grouped_vs_5_year_treasury_b.png)
January 2018 to December 2022 Commercial MLS Miami Association of Realtors, Property Types Land-Commercial/Business/Agricultural/Industrial, Commercial/Industrial, within Miami-Dade County, Price $1,000,000+, Calculated from 1,371 Listings, Retrieved 1/10/23 | Board of Governors of the Federal Reserve System (US), Market Yield on U.S. Treasury Securities at 5-Year Constant Maturity, Quoted on an Investment Basis [DGS5], retrieved from FRED, Federal Reserve Bank of St. Louis, January 9, 2023.
The second chart is of the same data as in the prior chart, but plotted over the entire period, i.e. not grouped by year, and plotted against the rocket fuel for this surge, interest rates, here represented by 5-year US Treasury yields. The surge from around Q2 2021 through Q2 2022 is more evident when viewed this way. Also standing out is the negative correlation between interest rates and commercial property sales, albeit perhaps with a slight lag. What is lost when viewed this way is the year over year, i.e. season versus season, and particularly December versus December, comparison.
Also interesting to note is that that this is the number of closed sales as a percentage of the five year average, with that average itself elevated by the results during the sales surge. This creates what I’ll call a denominator effect, with percentages outside of the surge appearing weak when in truth they’re probably just more normal. As an illustration of this denominator effect, the peak sales of December 2021 were 370% of the average from 2018 to 2020 vs. 254% of the entire five year period. Similarly, the 48.1% trough of October 2021 improves to 70.1% when considered versus this 2018 to 2020 period.
It is important to note that this data is not perfect. First, this only represent sales that were recorded in the Miami Association of Realtors Commercial MLS. Regardless, given that this is apples to apples, I believe it is reasonably representative of general trends over time. Also, this is only for sales of properties over $1M.Thus, changes in overall market pricing would affect the numbers. In this case, in what has been a rising market, sales in later years are likely a bit elevated vs. prior years simply because rising prices pushed sales above this threshold on properties than in prior periods would have traded below it. Given the rise of prices over the past five years, there is surely some such effect, particularly when considering 2022 vs. 2018. However, such an effect would likely not be enormous, and would be more at that extreme of the end of the five years vs. the beginning. The aforementioned denominator effect isn’t a data flaw, but could be seen as somewhat of a distortion of ratios. The bottom line, with all of this, as you view these charts, think about the variables, and consider that these charts are perhaps insightful, but (again) not perfect.
0 Comments
Commercial Borrowing Cost: Rate Watch for December 30, 2022
U.S. Treasury 5 Year Nominal Rates Dec 30, 2017 to December 30, 2022
The interest rate environment has changed fairly dramatically over the past 18 months. At the end of 2022, five year treasury rates, most closely tracked for commercial property borrowing cost, closed at 3.99%, up from the 0.2% to 0.4% range it was bouncing around within during the months preceding February 2021. If one considers this essentially 4% versus 0.5%, then this would represent a 350 bp increase. If CRE financing is assumed at 2.25% over the five year treasury yield, this would mean an interest rate of 2.75% would increase to 6.25%, more than double. Considered practically, the principal and interest (P&I) for a 15 year mortgage, per million, would increase 26% from $9,784 to $12,326. For a 25 year million dollar mortgage, it would increase by 48%, from $6,651 to $9,483. Considering this in reverse, buying power in terms of P&I, i.e. debt per dollar of P&I, decreases by 21% for a 15 year mortgage, 30% for a 25 year, given these assumptions. These are hypothetical assumptions, mind you, but the real effect in the marketplace has at least approached these levels. The bottom line is that buyers utilizing financing to purchase property now have larger monthly debt service expense at the same price, and consequently have reduced buying power. Those buyers paying cash in turn have less competition.
“A bank is a place that will lend you money if you can prove that you don’t need it.”
~Bob Hope
The interest rate environment has the ability to affect commercial property economics in a number of different ways (see this, this, and this). Borrowing costs are, of course, affected directly, as higher interest rates increase the cost of borrowing and thus negatively affecting demand. Cap rates tend move over time with interest rates, but not in lockstep, with considered analyses generally concluding that capitalization rates on average move in the same direction as 10-year rates, but only about a third as much, and again not in lockstep. Interest rates also affect the economy, which in turn affects vacancy and rental rates.
0 Comments
Chart – Inflation Watch New Year’s Day 2023: TIPS Indicating 2.33% Expected Inflation for Next 5 Years
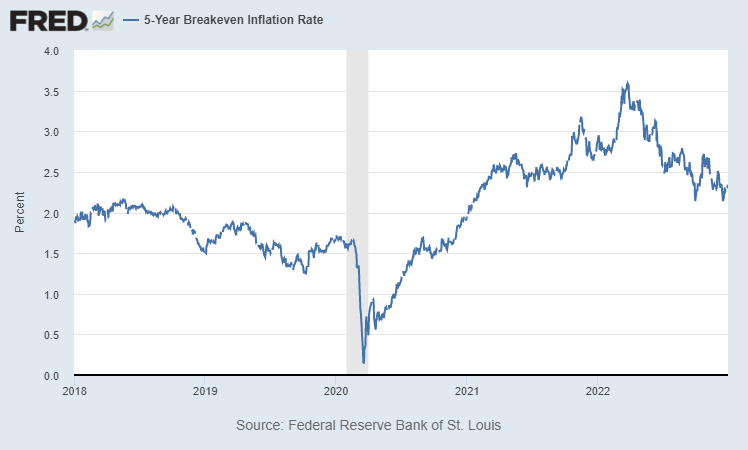
The chart above is of the 5-Year breakeven inflation rate, commonly referred to as the TIPS spread, for the five year period ending on December 30, 2022, the last trading day of 2022. This illustrates the difference in the yields, i.e. the spread, between United States Treasury bonds and Treasury Inflation-Protected Securities (TIPS) of the same maturity. This is a useful and oft-quoted measure of expectations for (CPI) inflation in the financial markets. The spread indicates expected inflation, of interest to investors in commercial real estate – more on that below – and for that matter investors of all kinds.
As one can see in these charts, the 5-year TIPS spread hit a high in March, 2022 at 3.59%. As the Fed has maneuvered aggressively to tap inflation down, this has now pulled back to its year end 2022 level of 2.33%, which would be markedly down from the actual inflation of 7.1%, as measured by the CPI, in the year ending November 2022. This indicates that financial markets are confident that inflation is coming down, that the Fed is “on it” and will get the job done, likely sooner rather than later given that five year expectation level as compared to recently inflation readings. Investors are putting their money on a bet that inflation it going to be at this 2.33% level on average for the next five years. This indication may be wrong, of course; traders lose money – cough FTX – all the time, after all. The relevance here is that numbers paying close attention and that are putting their money on the line believe inflation is going to subside.
“I don’t mind going back to daylight saving time. With inflation, the hour will be the only thing I’ve saved all year.”
~Victor Borge
Not Just Opinions, Real Money is on the Line
Real money is at stake with these spreads. TIPS pay interest every six months, based on a fixed rate that is calculated by multiplying the adjusted principal by one-half the calculated interest rate (i.e. half a year’s worth of inflation at that rate). Thus, a “bet” that an investor makes in with these bonds has real financial implications. If actual inflation is higher than priced in the markets, a TIPS buyer will make more that a straight treasury buyer. If it is lower, that TIPS buyer will make less. How much money is at stake? In 2017 Morningstar pegged the market at $1.2 trillion. Thus, every 1/10% difference is a $1.2 billion swing. That is real money by my count.
Also seemingly relevant to the topic of effectiveness of this spready to predict inflation is a research piece put out by the Bureau of Labor Statistics in 2019: Inflation expectations and inflation realities: a comparison of the Treasury Breakeven Inflation curve and the Consumer Price Index before, during, and after the Great Recession. It concluded that TBI (Treasury Breakeven Inflation) rates reasonably approximated inflation reality before, during, and after the Great Recession of 2007-2009. It noted that the average and median deviations between TBI rates and their respective annualized CPI-U inflation rates never exceed 81 basis points, and that, moreover, the dispersion of deviations, as measured by standard deviation and range, decreased as the maturity horizon increased. It went further to speculate that given that TBI expectations overshoot actual inflation in the long term and undershoot inflation in the short term, it is likely that the liquidity premium has a considerable effect in the short term but gets more than offset by the inflation premium in the long term.
Generally on Inflation and Commercial Real Estate
What is the impact of inflation on commercial real estate? In the near term, higher inflation tends to bring higher interest rates. Higher interest rates are a negative for commercial real estate. Higher rates means larger debt service payments, reducing the buying power of purchasers, and negatively impacting deal economics. It also means makes fixed income investments a more competitive investment, likely pulling capitalization rates (cap rates) up, and thus prices down. Over a longer period, however, the prospect of inflation leads to a principal benefit of commercial property investment, that of its potential as a hedge against inflation. After all, more inflation should lead to higher rent, at least in time.
MIT published an excellent whitepaper on real estate’s ability to keep pace with inflation with data to 2016. They looked at then tendency of retail, multifamily, industrial, and office income and values to keep pace with inflation. The best at keeping pace income-wise was retail, with rent growth of 102% of inflation. Office was the worst performing at a quite dismal 18%. Values across the property types were more consistently kept pace, with retail again doing the best appreciating at 107% of inflation, office again the worst at 74% of inflation. I’ll speculate that the fairly drastic difference between income and value keeping pace with inflation is driven by vacancy. If you’re interested in the topic, read the paper.
Expectations for inflation also come into play with lease structure and due diligence. A lease structure with a fixed rent increase becomes less attractive for a landlord with higher inflation expectations. Similarly, a commercial property being acquired with existing leasing in place that have fixed or capped rent increases looks less attractive as inflation expectations increase. Also, a property being purchased with fixed rate financing will look increasingly attractive if a buyer anticipates inflation fueled increases in income. Inflation, in short, is very important to commercial property investors.
Destinations Related to this TIPS Spread Post:
- WSJ US Treasury Quotes
- WSJ US Treasury Inflation-Protected Notes
- JP Morgan: Reading Inflation Expectations from the Treasury Market
- Investopedia: The Tips Spread
- Learning Markets: Monitoring Inflation with the TIPS Spread
- US Bureau of Labor Statistics Consumer Price Index (CPI) Page
- Kansas City Fed: Can TIPS Help Identify LongTerm Inflation Expectations?
0 Comments