We recently extracted some office building sales data from Costar, specifically sales by quarter. We were looking at sales in units, not dollars, to get an idea of what percentage of properties were turning over. As those in the industry can attest, sales have been increasing.
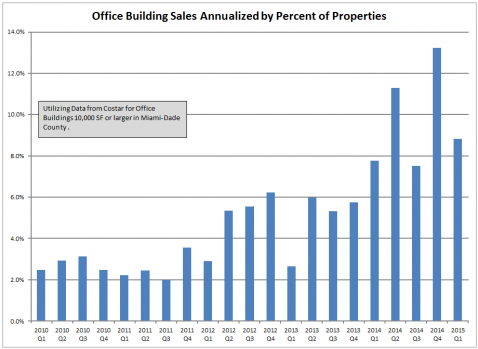
Office Building Sales Annualized by Percentage of Properties Miami-Dade County
After hovering at around or just over 2% throughout 2010 and 2011, sales began to pick up pace in Q2 of 2012. Early on the increase was notable, as sales more than doubled to more than 4% annually. Beginning in 2014, however, sales really picked up steam, passing “notable” on their way to “jeepers” with annualized sales around 8% or more, even 13% in one quarter, four to six times the rates in the aforementioned 2010 to 2011 period. This growth in the number of properties that sold matches up well with the growth in dollar volume of sales of commercial property.
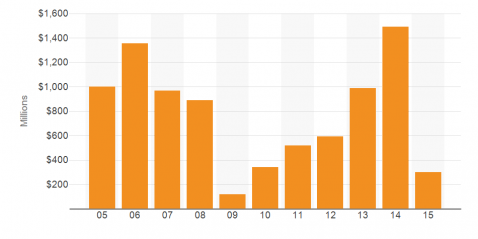
After hovering around a billion dollars per year in 2005 to 2008, sales of office properties did their best Tom Brady imitation as they went off a cliff to around $100 million in 2009. From there, they climbed, but only steadily and incrementally, not reaching their billion-ish level again until 2013. In 2015, they climbed further to near $1.5 billion, and appear on track for another $1 billion plus level in 2015.
What gives?
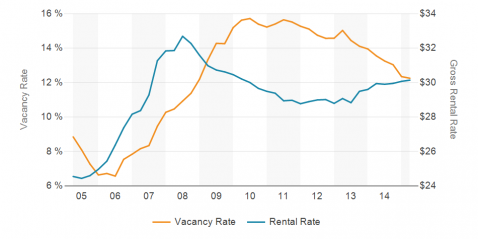
It is always a bit of a guess as to why certain property types turn over more than others in different periods. One reason for the momentum in office buildings may be the pain of recent years, with higher vacancy rates and lower rental rates during this time causing pain, combined with recent improvements in these measures now providing a means for exiting that which caused the pain. This can be felt rather clearly when one considers vacancy and rental rates in recent years.
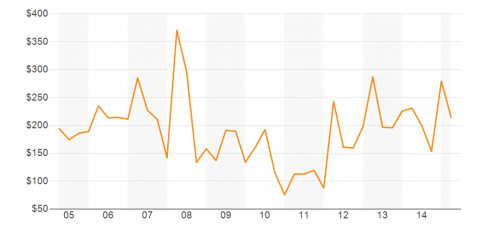
Office vacancy rates, after sitting at single digits in 2005, 2006, and 2007, began their steady and painful climb to 15%, then stayed at double digits thereafter. Most recently measured at around 12%, they are at their lowest level since 2008. This vacancy rate placed and kept tenants in control of pricing, causing gross rental rates to decline from the lower 30s peak in 2008 to a rough in 2011 to 2013 around $29 psf. Of late, they are on a firming trend, something likely not overlooked by buyers as sales prices firm up since 2011.
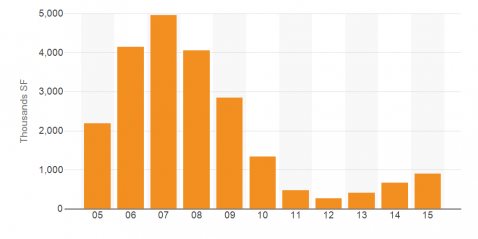
All this is a graphic history of pain for office property owners, followed by a better opportunity than there has been in a while to divest of the asset(s) that caused the pain. At the same time, Miami is increasingly on the mind of investors as a place of opportunity for commercial real estate, with that opportunity driven by economic growth, foreign inflows of investor capital, and recognition of the area’s lifestyle benefits. Office property construction also is not at high levels, further garnering the attention of buyers.
Sales of office properties are increasing, whatever the reason. As to whether this is an indication to buy or sell yourself, the answer is the proverbial (and our standard) “yes.”
A PDF of this piece is available here.
Charts and data courtesy of Costar.

