In a recent Business Insider article, the indicator with an almost perfect record of predicting US recessions is edging towards a tipping point, Macquarie Bank was quoted, “The yield curve has inverted within the 24 months preceding each of the past five recessions, and has only inverted once without a recession following in the ensuing two years.” That, folks, is a record worthy of attention.
So let’s look at what has been happening with the yield curve, paying particular attention to the spread between the 2-year and 10-year treasuries, generally observed as the most relevant single gauge.

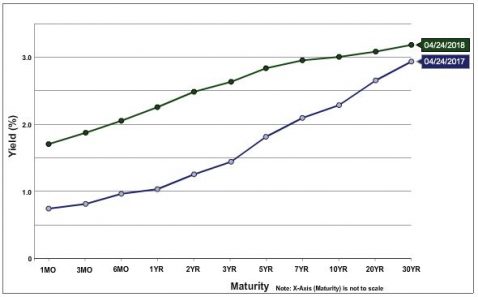
U.S. Treasury Yield Curve April 25, 2018 vs. One Year Prior
Above is a chart of the U.S. Treasury Yield Curve on April 25, 2018 versus one year prior. The flattening can be observed in the proportionately higher increase in rates in the short end (green line is new), with rates increasing near 100 bp for most shorter maturities, while longer-term maturities increased, but significantly less.

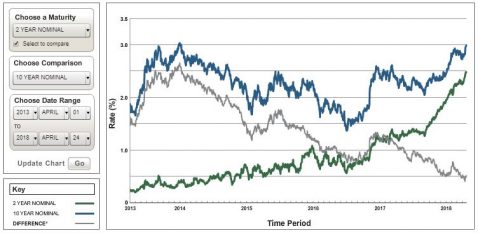
Historical Two and Five Year U.S. Treasury Yields and Differential for the Five Years Ending April 25, 2018
This flattening of the yield curve can be observed directly in the second chart, Historical Two and Five Year U.S. Treasury Yields and Differential for the Five Years Ending April 25, 2018. In this chart, the grey “differential” line can be observed to steadily decline. In the aforementioned BI article, this trend is judged to be heading toward a 2019 meeting with zero, i.e. a flat yield curve.
Macquerie Bank notes this as happening reliably up to two years prior to the beginning of a recession, not necessarily immediately preceding one. Thus, if all this holds, this would seem to indicate some likelihood of a recession in one to three years, a year for the spread between the 2-year and 10-year US Treasury rates to compress, then up to 2 years for the predicted recession to begin. The yield curve flattening could, however, flatten or even reverse, and the indicator could strike out this time. Time will tell, but of course the wisdom of economist Herbert Stein is bound to bear out in the end; if something cannot go on forever, it will stop.”
