
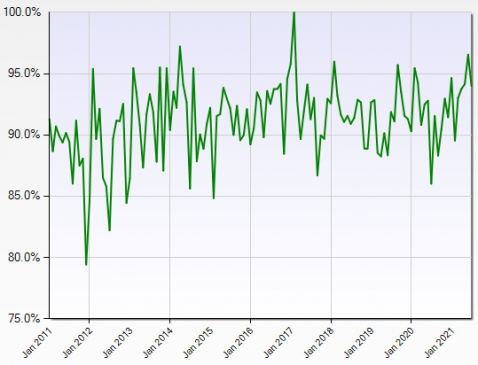
This chart displays the selling price to list price ratio as reported in the Miami Commercial MLS for improved commercial real estate (MLS classification: commercial/industrial) within Miami-Dade county, including cities within, in the sunny state of Florida that were priced from $1 million to $10 million and that closed from January 2011 to July 2021. This ratio dipped a touch to 94% from 96.6% in the prior month. It sits in the upper end of a range for the prior ten years.
“I don’t set trends. I just find out what they are and exploit them.”
~Dick Clark
One can further gauge the relative strength of the market by viewing a chart of (this month’s and going back 10 years) July 2021 commercial property sales for Miami-Dade commercial real estate. To get a general idea of how much commercial property tends to trade in the area, see our post where we chart estimated turnover for Miami-Dade commercial property from 2016 to 2020.